.png)

Renewable Energy TIV Assessment: A Step-by-Step Guide for Insurers and Lenders
Renewable energy TIV assessment is one of the most consequential and least standardized processes in infrastructure finance today. Total insured value determines coverage limits, drives premiums, anchors collateral assessments, and sets the ceiling on what gets paid out when something goes wrong. For insurers pricing solar and BESS risk, it is the foundational input behind every underwriting decision. For lenders evaluating collateral exposure, it is the number that answers the question no one wants to get wrong: if this asset fails, what does it actually recover?
The global solar plant insurance market generated $5.6 billion in premiums in 2024 and is projected to reach $13.8 billion by 2034, a 9.4% compound annual growth rate. Behind that growth is a valuation infrastructure that has not kept pace with the speed and complexity of the market it is supposed to underpin.
This guide walks through a step-by-step renewable energy TIV assessment process for solar and BESS portfolios, the specific inputs that most assessments get wrong, and what defensible valuation looks like in a market that is moving faster than legacy methodology was built to handle.
Why Renewable Energy TIV Assessment Is Broken Right Now
Before walking through the process, it is important to understand why the current standard is failing.
The 2026 renewable energy insurance market begins in a markedly different place than previous years, driven by policy and geopolitical changes alongside the growing maturity of renewables. Three structural shifts have converged simultaneously to make legacy TIV methodology inadequate.
Commodity markets are repricing sharply upward. Copper hit a record $14,527 per metric ton in January 2026, a 16% rise from December 2025 alone. Silver gained more than 130% during 2025 and reached an all-time high above $121 per ounce in January 2026. (Crux Investor, March 2026 / Investing News Network, April 2026) These are the same materials embedded in every solar panel, inverter, and battery system in the field. A TIV that does not reflect current commodity values is not a current TIV.
Module pricing is no longer predictable. US solar module prices rose 14% between January and November 2025. Antidumping and countervailing duties of up to 3,521% on imports from Cambodia, Vietnam, Malaysia, and Thailand, which represented 77% of total US module imports, pushed replacement cost economics to levels that pre-tariff pricing assumptions cannot support. (US Department of Commerce, April 2025)
The underwriting market has drawn a hard line on valuation accuracy. 75% of renewable energy tax insurance underwriters will not cover valuation step-ups above 25%. That is not a pricing constraint. That is a market access constraint. A TIV that needs to be corrected upward by more than 25% at renewal does not just trigger a higher premium. It triggers restricted coverage from the majority of the underwriting market. Against that backdrop, here is how a defensible renewable energy TIV assessment should be structured.
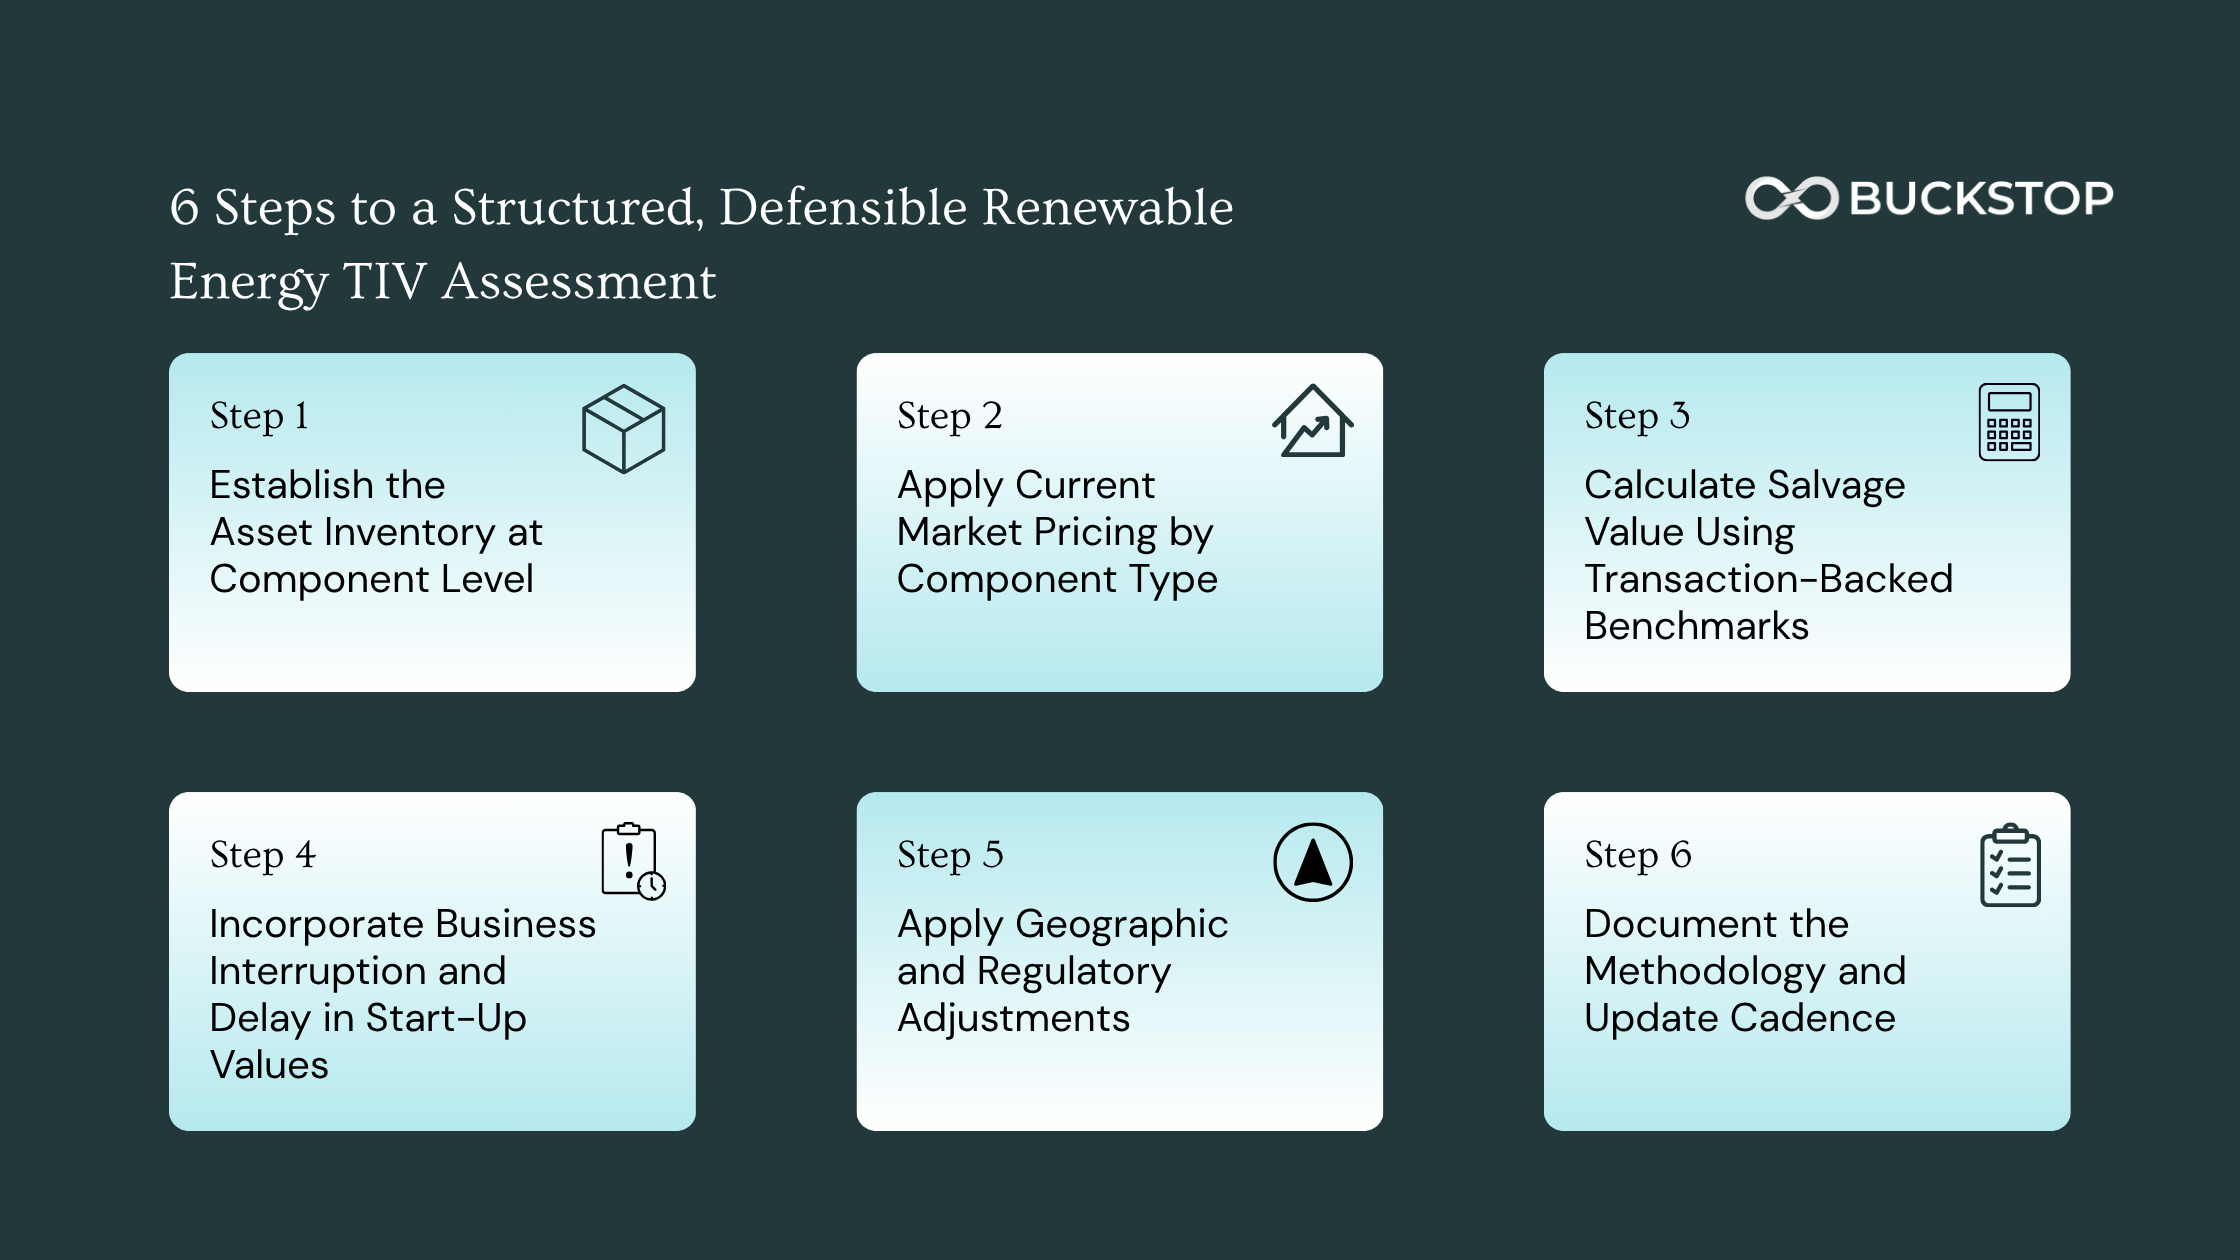
Step 1: Establish the Asset Inventory at Component Level
Every renewable energy TIV assessment starts with a complete, current, component-level asset inventory. Not the equipment list from the EPC contract. Not the specifications from financial close. What is actually in the field, today, by manufacturer, model, technology generation, serial number range, vintage, and condition.
This distinction matters because solar insurance valuation methodology that relies on project-level specifications rather than actual deployed assets makes two systematic errors.
First, it misses equipment substitutions made during construction or operations and maintenance that changed the actual asset composition from what was specified. Second, it applies replacement cost assumptions based on the technology generation specified rather than the technology generation that would actually be used for replacement in the current market.
A 2020-vintage project specified with Mono PERC modules would be replaced today with TOPCon modules at current market pricing, given that TOPCon now represents 75% of Chinese manufacturing and is rapidly becoming the dominant commercial technology. Mono PERC hit $0.33 per watt in February 2026, significantly above TOPCon at $0.285 per watt, a pricing inversion driven by FEOC compliance demand. (PV Tech, April 2026) Using the wrong technology generation in a replacement cost calculation produces a systematically incorrect TIV.
What this step requires:
For solar assets, the inventory should capture modules by manufacturer, model, wattage, technology type, quantity, vintage year, and current condition rating. Inverters should be captured by manufacturer, model, capacity, quantity, and vintage. Racking and mounting systems by type, manufacturer, and configuration. Transformers and balance of plant by specification and vintage. For BESS assets, the inventory should capture battery modules by manufacturer, chemistry, capacity, vintage, state of health, and cycle count. Power conversion systems, HVAC systems, and battery management systems should be captured separately.
This is not a one-time exercise. 34.2% of substations inspected more than once in 2025 had a high priority anomaly. Asset condition changes over time in ways that affect both replacement cost and recovery value. (Raptor Maps via kWh Analytics, May 2026) An inventory that was accurate at financial close is not necessarily accurate three years later. Wikipedia
Step 2: Apply Current Market Pricing by Component Type
Once the asset inventory is complete, each component type needs a current replacement cost figure, not a historical cost figure, not an index-linked approximation of a historical cost figure, but an actual current market price for that specific component type under current tariff and supply chain conditions.
For solar modules, current replacement cost must account for technology-specific pricing, FEOC compliance requirements, and tariff exposure. The premium for domestically produced cells versus imported modules widened to approximately $0.23 per watt in 2025, reflecting the market's willingness to pay for tax credit and tariff compliance certainty. (PV Tech, August 2025) A project that requires FEOC-compliant replacement modules to maintain tax credit eligibility carries a higher replacement cost than a project without that constraint, and the TIV must reflect that.
For inverters, current pricing should account for manufacturer-specific availability, capacity range, and supply chain lead times. Inverter shutdowns are driving 28% of recoverable solar performance risk across 6.5 GW of analyzed assets. (kWh Analytics, May 2026) Replacement lead times for specific inverter models can run to six months or longer, which affects both replacement cost and business interruption calculations.
For BESS assets, replacement cost calculation requires battery chemistry-specific pricing. LFP battery systems typically receive more favorable insurance rates than NMC systems due to lower thermal runaway propagation risk. (Solarif, January 2026) They also carry different replacement cost profiles. NMC pricing is more sensitive to nickel, manganese, and cobalt commodity movements. LFP pricing is more sensitive to lithium and iron phosphate availability. A BESS TIV assessment that treats all battery chemistry as equivalent is producing an average that accurately describes none of the specific assets being valued.
For balance of plant and civil infrastructure, current labor rates by geography and current material costs should be applied. Labor costs vary significantly by state and have moved with broader construction cost inflation. A TIV built on 2021 labor assumptions in a state where construction labor costs have increased by 15% since then is systematically understated.
Step 3: Calculate Salvage Value Using Transaction-Backed Benchmarks
Salvage value is the most frequently mispriced input in renewable energy TIV assessment and solar residual value calculations for lenders.
It is also the most consequential. Salvage value is a direct offset against net replacement cost and against decommissioning bond sizing. An understated salvage value overstates net TIV. An overstated salvage value understates net TIV. Either direction creates financial exposure, one through underinsurance and one through excess premium payment and inflated bond requirements.
Most TIV assessments calculate salvage value as a static percentage of replacement cost, often in the range of 5 to 15%, based on comparable-site estimates or consultant assumptions that have not been updated to reflect current secondary market conditions.
The actual secondary market for solar and BESS assets is considerably more dynamic. Copper above $13,000 per metric ton and silver at an all-time high above $121 per ounce mean that the scrap value of a utility-scale solar asset's metallic content is materially higher today than any 2022 or 2023 benchmark would suggest. The repowering wave, driven by utilities replacing functional 350W panels with 650W panels years before end of life due to AI data center demand, is creating a growing secondary market for panels with significant remaining useful life that carries reuse economics well above scrap value.
European and Japanese banks dominated BESS project finance in 2025, with the top five lenders by capacity all being non-US institutions. (Modo Energy, February 2026) International lenders are increasingly sophisticated about residual value methodology. A salvage value figure that cannot be supported by transaction-backed data is no longer adequate for credit committee purposes at these institutions.
Transaction-backed salvage value benchmarking requires tracking real observed outcomes across four distinct recovery pathways. Resale into the secondary market, which carries reuse economics that depend on asset condition, remaining useful life, technology vintage, and secondary market demand. Refurbishment and redeployment, which applies to assets with significant remaining useful life that require work before resale. Recycling, which is driven by commodity prices for the specific materials in the asset. And scrap, which is the floor value driven by metallic content at current commodity prices.
Buckstop's residual value indexes are built from observed market data across all four pathways, tied to actual recovery outcomes rather than assumed percentages. The methodology accounts for manufacturer, age, wattage, condition, configuration, and geographic and regulatory factors that influence which pathway is economically optimal and what that pathway returns.
Step 4: Incorporate Business Interruption and Delay in Start-Up Values
Business interruption and delay in start-up exposures are increasingly material components of renewable energy TIV assessment that most processes underweight.
Business interruption and delay in start-up exposures are expected to increase in 2026 as aging transmission equipment and increased congestion create longer and more frequent outages, and data centers amplify local grid stress. In solar, grid-originating outages were one of the biggest BI cost drivers of 2024 and 2025. (NARDAC, December 2025)
BI values in most solar TIV assessments are set at financial close based on projected revenue and updated rarely if at all. When replacement timelines extend due to supply chain constraints, tariff-related parts availability issues, or contractor capacity limitations, the BI exposure embedded in the TIV grows but the declared value does not.
For BESS assets, 75% of BESS sites show early HVAC-related thermal risk signals. (PowerUp via kWh Analytics, May 2026) HVAC failures that accelerate battery degradation can trigger replacement timelines that extend well beyond standard BI assumptions, particularly for NMC systems where thermal management is critical to safe operation.
Current BI value calculation should be based on current power purchase agreement pricing or merchant price assumptions, current grid interconnection queue timelines in the relevant ISO or RTO, current supply chain lead times for critical components, and current contractor availability in the project's geography. All four of these inputs have moved materially since most existing BI values were set.
Step 5: Apply Geographic and Regulatory Adjustments
A defensible renewable energy collateral valuation is not geography-agnostic. Two projects with identical asset compositions can have materially different TIVs depending on where they are located and what regulatory requirements apply.
State-specific labor rates affect replacement cost. Permitting timelines affect BI calculations. Recycling mandates and extended producer responsibility schemes affect salvage value calculations by determining which recovery pathways are legally required versus commercially optional. Financial assurance requirements affect the relationship between TIV and decommissioning bond sizing.
More than 35 states now have statewide solar decommissioning policies, and more than half of all US states had legislative action on solar and storage decommissioning in 2025, double the number from 2024. (NC Clean Energy Technology Center, January 2026) State financial assurance requirements mandate bond amounts that cover removal, recycling, and restoration minus salvage value. That legal definition connects TIV directly to bond sizing in ways that most assessments treat as separate workstreams.
For BESS assets specifically, energy storage insurance requirements in 2026 vary significantly by project size, location, and technology type, with most insurers now mandating detailed risk assessments and safety certifications before providing coverage. (Solarif, January 2026) LFP systems require different documentation than NMC systems. State fire codes vary in their requirements for suppression systems, separation distances, and monitoring capabilities. Geographic exposure to flood, wildfire, and severe convective storms affects both the replacement cost assumptions and the risk premium structure.
California, Texas, and Arizona account for approximately 74% of utility-scale BESS capacity in the US. (SEIA Energy Storage Market Outlook, Q1 2026) Each state carries distinct regulatory and cost conditions. A TIV that does not account for state-specific inputs is producing a national average that accurately describes none of the individual projects within the portfolio.
Step 6: Document the Methodology and Update Cadence
The final step in a defensible renewable energy TIV assessment is documentation, and it is the step most frequently skipped.
Structured data is no longer a differentiator for insurers and lenders. It is a requirement. (NARDAC, December 2025) An underwriter reviewing a TIV submission needs to understand not just what the numbers are but how they were calculated, what data sources were used, when those sources were last updated, and what methodology was applied to translate raw data into valuation outputs. For the 75% of renewable energy tax insurance underwriters who will not cover valuation step-ups above 25%, the methodology documentation is what determines whether a corrected TIV is acceptable or whether the coverage is simply unavailable. A number without a methodology is not a defensible TIV. It is an assertion.
Documentation should cover the component-level asset inventory and the date it was last verified against actual deployed assets. The replacement cost pricing sources by component type and the date of the most recent market check. The salvage value benchmarks used, the transaction data underlying those benchmarks, and the recovery pathway assumptions applied. The BI value calculation methodology including the revenue assumptions, replacement timeline assumptions, and supply chain lead time data used. The geographic and regulatory adjustments applied and the sources for those inputs.
Update cadence is as important as documentation. Given that copper rose 16% in a single month in early 2026, and that module prices moved 14% in a single year, annual updates are the minimum appropriate standard for any TIV connected to a live debt facility or active insurance policy. For portfolios with significant BESS exposure, where technology pricing and chemistry-specific commodity inputs can move materially within a six-month period, semi-annual reviews of key pricing inputs should be considered.
What Insurers Specifically Need From a TIV Assessment
For insurers, a renewable energy TIV assessment that meets current utility scale solar underwriting checklist standards needs to address four questions that legacy submissions frequently leave unanswered.
What would it actually cost to replace this specific equipment at current market prices? Not a project-level per-watt estimate. A component-level replacement cost by manufacturer, model, and technology type at current tariff-inclusive pricing.
What is the salvage value based on real transaction data? Not a percentage assumption. An observed benchmark across relevant recovery pathways supported by recent transaction data.
How long would replacement take and what does that mean for BI exposure? Not a standard industry assumption. A supply chain-aware estimate based on current lead times for the specific components at this project in this geography.
Has this TIV been updated to reflect current market conditions? An undated TIV or one linked to a general inflation index without specific market pricing verification is not adequate for underwriting purposes in the current environment.
What Lenders Specifically Need From a TIV Assessment
For lenders, solar residual value assessment for collateral purposes requires answering a different but related question: in a distress scenario, what would these assets actually recover?
This is fundamentally a liquidation value question, not a replacement cost question. Replacement cost tells you what it would cost to rebuild. Liquidation value tells you what a buyer in the secondary market would pay for the existing assets as-is, in their current condition, under current market conditions.
The gap between replacement cost and liquidation value varies significantly by asset type, condition, technology vintage, and market timing. In European BESS financing, project finance accounted for 50% of deals in 2025, while acquisitions made up 26%, pointing to a maturing secondary market where developers build and then sell operational assets to long-term holders. (Modo Energy, March 2026) As the secondary market matures, liquidation value benchmarks become more observable and more defensible.
For lenders evaluating renewable energy collateral valuation on a new facility, the TIV-based replacement cost provides an upper bound on asset value. Transaction-backed residual value intelligence provides the recovery value range across multiple liquidation pathways that is more directly relevant to collateral assessment. Both are needed. Neither alone is sufficient.
Energy storage insurance requirements for BESS-backed facilities add additional complexity. One underwriter described pricing 2026 BESS renewals as calibrating on both technology risk and climate trajectory simultaneously, with very thin data on either. (Repath.earth, March 2026) Lenders whose collateral includes significant BESS exposure need valuation methodology that specifically accounts for battery chemistry, state of health, cycle count, and the range of recovery outcomes across different degradation scenarios.
The Bottom Line
Renewable energy TIV assessment is not a compliance exercise. It is a financial risk management function that directly determines whether insurers are pricing risk accurately, whether lenders are assessing collateral correctly, and whether asset owners are carrying the right coverage for what they actually own. The US renewable fleet is entering a period of unprecedented demand, hitting a critical inflection point where operational nuance is as vital as hardware procurement.
The six-step process outlined above, component-level inventory, current market pricing, transaction-backed salvage values, current BI values, geographic and regulatory adjustments, and documented methodology with a disciplined update cadence, is what defensible TIV looks like in a market characterized by module price volatility, commodity repricing, tariff disruption, and a tightening underwriting market that has made valuation accuracy a condition of coverage access rather than a differentiator.
The teams getting this right in 2026 are the ones treating TIV assessment as a live data problem, not a one-time valuation exercise. Buckstop builds transaction-backed residual value intelligence for solar and BESS assets across resale, refurbishment, recycling, liquidation, and scrap pathways. Explore Buckstop.
Frequently Asked Questions
What is a renewable energy TIV assessment?
A renewable energy TIV assessment is the process of calculating the total insured value of a solar, BESS, or mixed renewable energy portfolio for insurance and lending purposes. It involves establishing a component-level asset inventory, applying current replacement cost pricing by component type, calculating transaction-backed salvage values across relevant recovery pathways, incorporating business interruption values, applying geographic and regulatory adjustments, and documenting the methodology and update cadence. TIV is the foundational number that determines coverage limits, premium calculations, and collateral assessments for renewable energy infrastructure.
Why do most renewable energy TIV assessments produce inaccurate results?
Most renewable energy TIV assessments produce inaccurate results because they are calculated at financial close using system-level per-watt estimates and updated infrequently using general inflation indices rather than asset-specific market pricing. US module prices moved 14% in a single year. Copper rose 16% in a single month in early 2026. Antidumping duties fundamentally changed replacement cost economics for the majority of US solar supply. Legacy TIV methodology was not designed to track market movements of this speed and magnitude, and the update cycles most assessments follow are too infrequent to maintain accuracy in the current environment.
What is the difference between TIV and collateral value for a renewable energy asset?
TIV is a replacement cost-based measure of what it would cost to rebuild or replace the insured assets at current market prices. Collateral value for a lender is more closely related to liquidation value, which is what the assets would actually recover in the secondary market in a distress scenario. Replacement cost is typically higher than liquidation value. Lenders need both: TIV to understand the insurance coverage adequacy and liquidation value to understand the actual collateral exposure. Transaction-backed residual value intelligence, built from observed secondary market outcomes, provides the liquidation value benchmarks most relevant to collateral assessment.
How often should a renewable energy TIV be updated?
Given current market conditions, annual updates reflecting current module pricing by technology type, current commodity values, current tariff-inclusive replacement costs, and current secondary market transaction data are the minimum appropriate standard. Semi-annual reviews of key pricing inputs should be considered for portfolios with significant BESS exposure, where battery chemistry-specific commodity movements can materially affect TIV within a six-month period. Many state decommissioning regulations require cost estimates to be reviewed only every five years, but that cycle is not adequate for TIV purposes in the current market environment.
What energy storage insurance requirements affect BESS TIV assessment?
BESS TIV assessment must account for battery chemistry-specific replacement cost and risk profiles, fire suppression system requirements that vary by state and insurer, thermal management system documentation requirements, battery management system certification standards, and state-specific safety code compliance. LFP systems typically receive more favorable insurance rates than NMC systems due to lower thermal runaway propagation risk. NMC replacement cost is more sensitive to nickel and cobalt commodity movements. Both chemistry types require documentation that most standard solar TIV processes are not designed to capture.
What makes a renewable energy TIV assessment defensible to an underwriter?
A defensible renewable energy TIV assessment for underwriting purposes must include component-level asset inventory verified against actual deployed equipment, replacement cost pricing by specific component type at current tariff-inclusive market prices, transaction-backed salvage value benchmarks supported by recent observed secondary market data, BI values based on current supply chain lead times and revenue assumptions, geographic and regulatory adjustments for the specific project locations, and clear methodology documentation with a stated update date and cadence. The 75% of renewable energy tax insurance underwriters who will not cover valuation step-ups above 25% are specifically looking for this level of methodological rigor before accepting a corrected TIV submission.
How does salvage value affect renewable energy TIV and decommissioning bonds?
Salvage value is a direct offset against net replacement cost in TIV calculations and against decommissioning cost in bond sizing calculations. An accurate salvage value reduces both the net TIV and the required decommissioning bond, freeing up capital. Most salvage value assumptions in current TIV assessments are static percentage estimates that have not been updated to reflect commodity price movements that have materially increased the metallic content value of solar and BESS assets. Copper above $13,000 per metric ton and silver at an all-time high mean that current scrap and recycling values are significantly above what pre-2025 assumptions reflect.