.png)

Solar Statement of Values: Why Replacement Cost Assumptions Are Costing Asset Owners Money
Every utility-scale solar project that carries property insurance has a Statement of Values on file somewhere. It lists the assets, assigns values, tells the insurer what the total insured value is, drives the premium, determines the payout if something goes wrong.
And in most cases, the replacement cost figure sitting inside that document is wrong. Not slightly but materially wrong. Wrong in ways that directly affect how much premium is being paid, how much coverage is actually available, and how much capital is unnecessarily locked up or dangerously exposed.
Solar asset replacement cost is not a static number. It never was. But for most of the industry's history, the rate of change was slow enough that a number calculated at project finance could hold up reasonably well for a few years. That is no longer true. The US solar plant insurance market generated $5.6 billion in premiums in 2024 and is projected to reach $13.8 billion by 2034. (Market us, October 2025) The assets being insured are more valuable, more volatile in their replacement economics, and more complex in their end-of-life recovery characteristics than the SOV assumptions backing most policies reflect.
This is the number missing from almost every Statement of Values: an accurate, current, defensible solar asset replacement cost figure that accounts for what it would actually cost to replace or recover that asset in the market today.
What a Statement of Values Is Actually Doing
A Statement of Values is the foundational document submitted by an insured party to an insurer that lists all insured properties, their values, and the valuation methods used. It is the basis for determining Total Insured Value, setting coverage limits, and calculating premiums. For utility-scale solar assets, the SOV modules, inverters, racking and mounting systems, transformers, BESS components, balance of plant, and civil infrastructure.
The valuation method used by insurers matters enormously. The three primary approaches are:
Replacement Cost Value (RCV): what it would cost to replace the asset at current market prices in its pre-loss condition, without deducting for depreciation.
Actual Cash Value (ACV): replacement cost minus depreciation.
Agreed Value: a fixed amount agreed between insurer and insured at policy inception, regardless of depreciation.
For utility-scale solar, replacement cost is the most commonly used basis. The problem is that most replacement cost figures in solar SOVs are calculated once, at or near project finance, and updated infrequently if at all. In a market where module prices moved 14% in a single year and then held at a new elevated baseline driven by tariffs and trade policy, a replacement cost figure from 2022 or 2023 is not a baseline. It is a liability.
Why Solar Asset Replacement Cost Is Harder to Calculate Than It Looks
Calculating an accurate solar asset replacement cost for large C&I and utility-scale solar requires accounting for variables that move independently and frequently. Most SOV processes do not capture them.
Module pricing volatility
US solar module prices rose by up to 14% between January and November 2025, driven by Chinese OEMs tightening supply for the first time in years. By Q1 2026, median module pricing had stabilized at $0.28 per watt, up from $0.25 per watt in early 2025. Antidumping and countervailing duties on solar imports from Cambodia, Vietnam, Malaysia, and Thailand, which represented 77% of total US module imports worth $12.9 billion annually, pushed the baseline price for utility-scale solar equipment to levels not seen since the early 2020s. (PV Magazine USA, April 2026)
The premium for domestically produced cells versus imported modules widened to approximately $0.23 per watt in 2025, reflecting the market's willingness to pay for tariff and FEOC compliance certainty. (PV Tech, August 2025) A module replacement cost assumption built on pre-tariff pricing understates the actual replacement cost by a meaningful margin, which means the total insured value is understated, which means the policy is underinsured.
Component-level value variation
Two utility-scale solar sites with identical nameplate capacity can have meaningfully different replacement cost profiles depending on module manufacturer, inverter type, racking system, vintage, and technology generation. A TOPCon module carries different replacement economics than a Mono PERC module. An NMC BESS system has different replacement characteristics than an LFP system. Generic per-watt replacement cost assumptions do not capture component-level variation.
Critical mineral content and salvage offset
State financial assurance requirements now legally mandate that decommissioning bond amounts are calculated as the estimated cost to decommission minus salvage value. The salvage value embedded in solar assets, the copper, silver, and aluminum in panels, inverters, and cabling, is a direct offset against replacement cost and decommissioning cost. Copper hit a record $14,527 per metric ton in January 2026. Silver reached an all-time high above $121 per ounce in the same month after gaining more than 130% during 2025. (Crux Investor, April 2026). A salvage value assumption built on 2022 commodity prices materially understates the offset, which overstates the net decommissioning cost and inflates the required bond.
Geographic and regulatory factors
Replacement cost is not geography-agnostic. Labor costs vary significantly by state. Permitting timelines affect replacement economics. California, Texas, and Arizona account for approximately 74% of utility-scale BESS capacity in the US. (SEIA Energy Storage Market Outlook, Q1 2026) Each state carries distinct regulatory requirements, recycling mandates, and extended producer responsibility schemes that affect both replacement cost and recovery value calculations.
The Underinsurance Problem Is Real and Growing
Utility-scale solar PV accounted for 31.55% of renewable energy insurance premiums in 2025. (Mordor Intelligence, January 2026) The US market alone represents an estimated $120 billion in total insured values across solar assets. (Amwins, 2024)
Against that backdrop, the data on valuation accuracy is sobering.
Severe convective storms drove $60 billion in insured losses in 2025, the third-costliest SCS year on record for insurers. Hail has accounted for more than $200 billion, or 42%, of all insured losses in the United States since 2020. (PV Magazine, May 2026) When a loss event hits a project whose SOV replacement cost was calculated in 2021 and never updated, the gap between the insured value and the actual replacement cost becomes immediately, painfully visible.
The kWh Analytics 2026 Solar Risk Assessment flagged valuation accuracy as a binding constraint on coverage access. 75% of renewable energy tax insurance underwriters will not cover valuation step-ups above 25%. (kWh Analytics via CAC, May 2026) That means if your assets have appreciated in replacement cost terms beyond what your SOV reflects, you are not just underinsured. You are blocked from accessing the majority of the underwriting market until your valuation is updated.
NARDAC's 2026 infrastructure and renewable insurance trends report was direct: structured data is no longer a differentiator for insurers. It is a requirement. (NARDAC, December 2025)
The Decommissioning Bond Connection
Solar asset replacement cost and solar decommissioning bond valuation are more connected than most asset owners realize.
More than 35 states now have statewide solar decommissioning policies in place. More than half of all US states had legislative action on solar and storage decommissioning in 2025, double the number from 2024. (NC Clean Energy Technology Center, January 2026) State financial assurance requirements mandate that bond amounts cover equipment removal, recycling costs, and site restoration minus salvage value.
That means an accurate solar asset residual value estimate directly reduces the required bond. And an inaccurate one, whether it overstates or understates salvage value, creates either unnecessary capital lock-up or regulatory exposure.
Buckstop analyzed a randomized sample of US utility-scale solar decommissioning bonds from 2025 and found salvage value estimates ranging from $3,000 per MW on the low end to $198,000 per MW on the high end, for similar assets. That is a $195,000 per MW gap driven almost entirely by inconsistent assumptions. 62% of projects clustered between $47,000 and $57,000 per MW. (Buckstop State of Solar Decommissioning Bonds Report, 2025)
In one project, Buckstop conducted a component-level analysis of a large utility-scale solar site and identified 389% more recoverable value than what the original EPC study had calculated. The EPC had used comparable-site assumptions. Buckstop went asset by asset using real transaction data across resale, recycling, and recovery pathways.
The implication for solar statement of values preparation is direct. If your salvage value assumption is wrong, your net decommissioning cost is wrong. If your net decommissioning cost is wrong, your bond is wrong. If your bond is wrong, your SOV is wrong. Every financial instrument downstream of that first assumption carries the error forward.
What Accurate Solar Asset Replacement Cost Calculation Requires
A defensible solar asset replacement cost figure for a utility-scale project requires four things that most SOV processes are not consistently delivering.
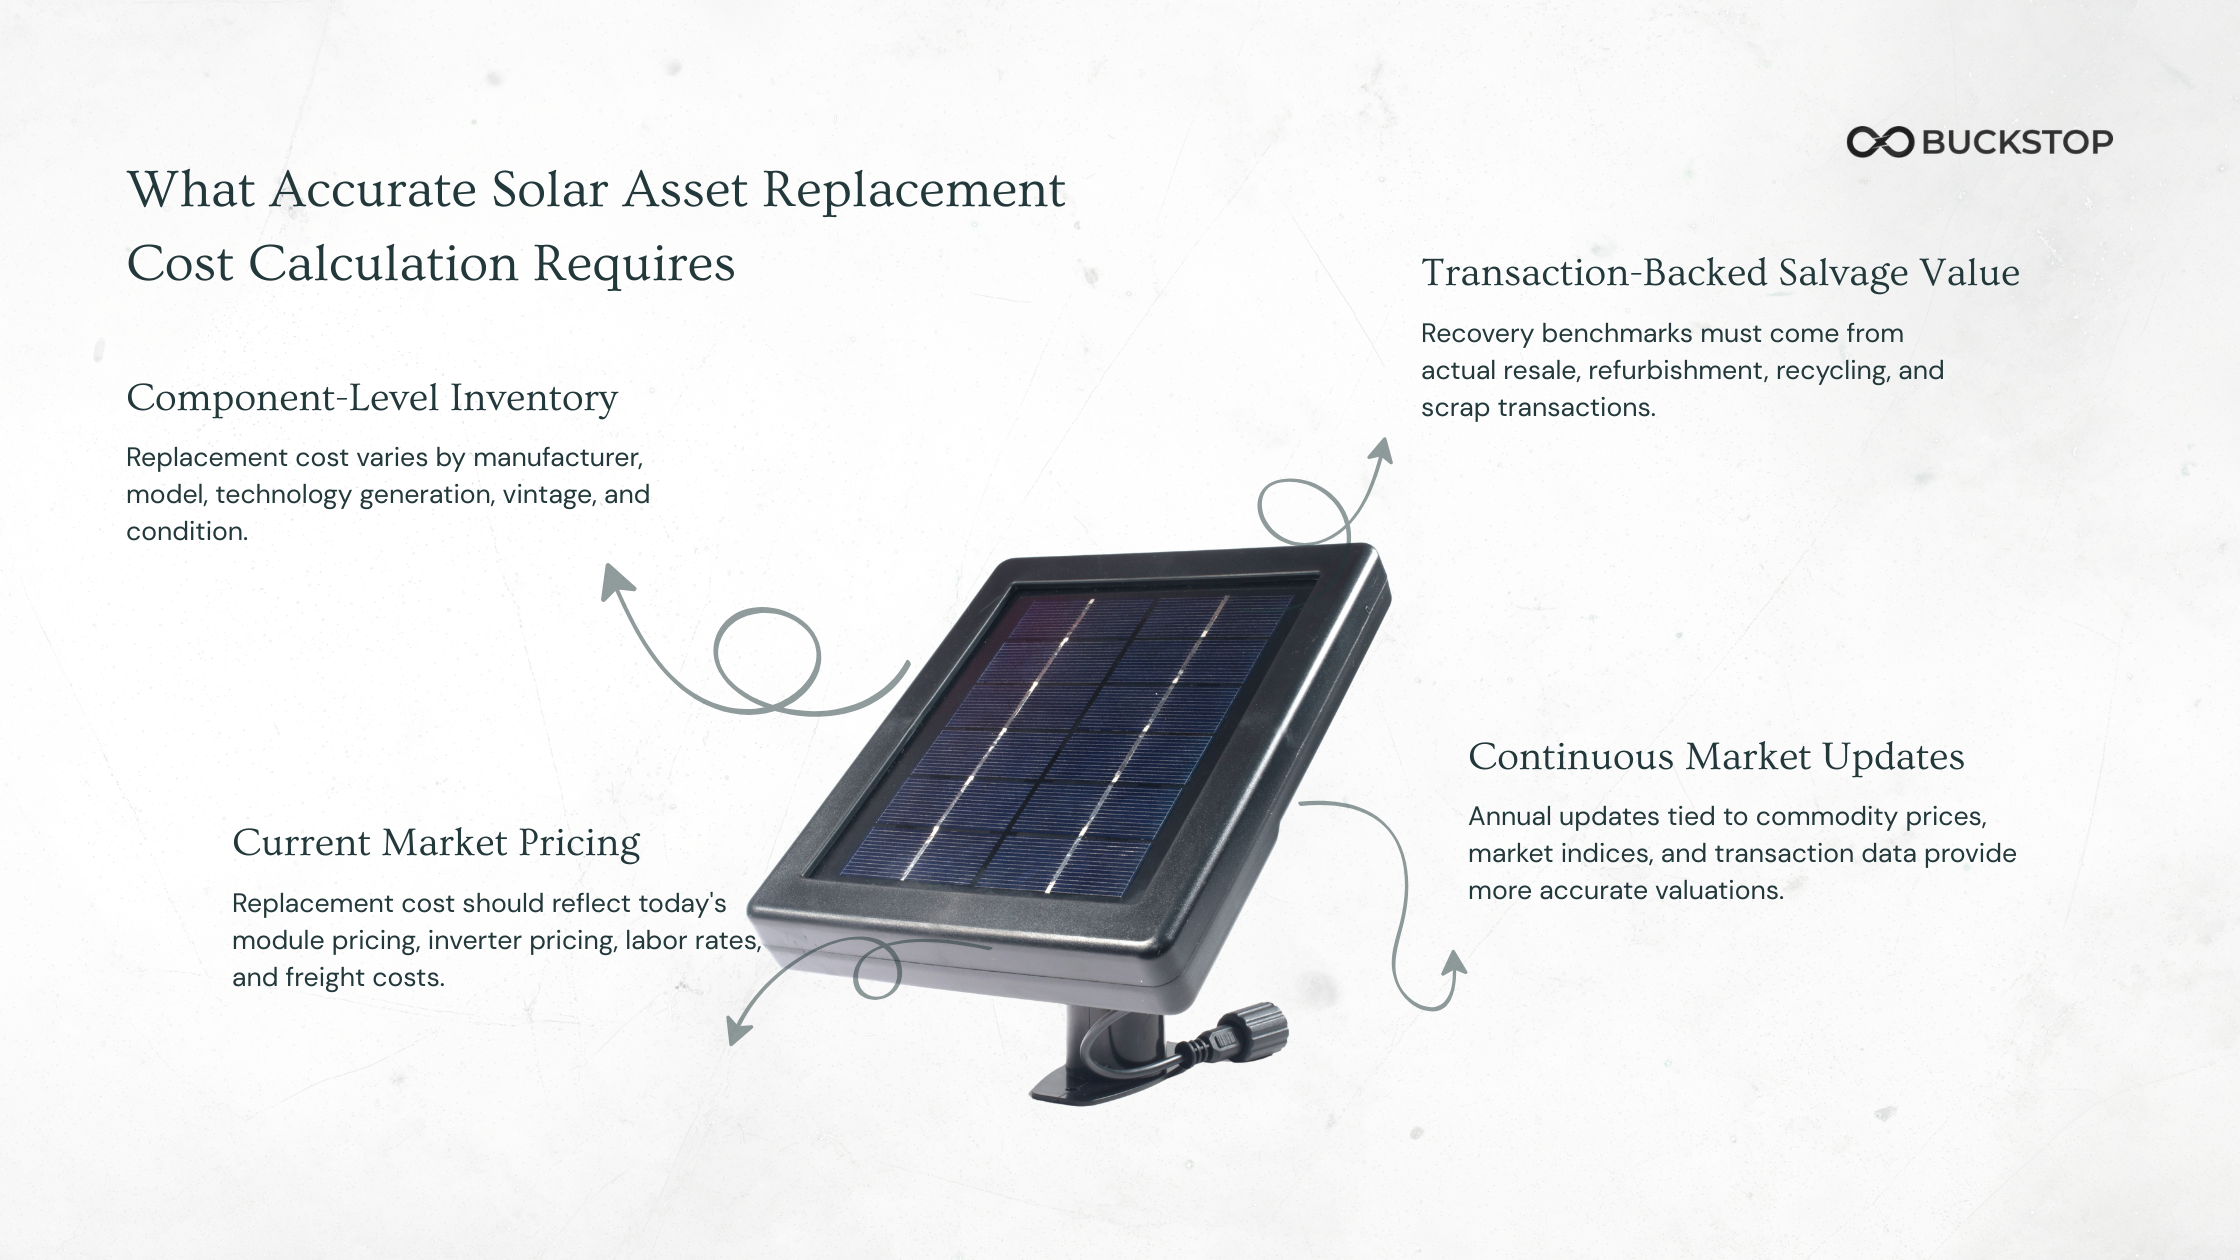
1. Component-level asset inventory rather than system-level estimates
Replacement cost varies by manufacturer, model, vintage, technology generation, and condition. Two projects with identical nameplate capacity can have meaningfully different replacement cost profiles once you go component by component. System-level per-watt estimates smooth over variation that materially affects both the replacement cost and the recovery value at end of life.
2. Current market pricing rather than historical cost
The replacement cost relevant for insurance purposes is what it would cost to replace the asset today, not what it cost to build it three years ago. US module prices rose 14% in a single year and then stabilized at a higher baseline driven by tariff enforcement and FEOC compliance requirements. A replacement cost figure that does not reflect current module pricing, current inverter pricing, current labor rates, and current freight costs is not a replacement cost figure. It is a historical record.
3. Transaction-backed salvage value benchmarks rather than static estimates
Solar salvage value insurance calculations require understanding what comparable assets are actually recovering across resale, refurbishment, recycling, and scrap pathways in real markets. Salvage value moves with commodity prices, secondary market demand, regional recycling infrastructure, and policy incentives. A static percentage assumption cannot track those variables.
4. Regular updates that reflect market conditions
Many states require decommissioning cost estimates to be reviewed only every five years. In a market where copper rose 16% in a single month, a five-year review cycle is not adequate for maintaining accurate solar total insured value calculations. Annual updates tied to commodity price movements, module price indices, and secondary market transaction data are the appropriate standard for assets whose replacement economics are actively moving.
How Buckstop Approaches Solar Asset Valuation
Buckstop builds transaction-backed residual value intelligence for energy assets across every recovery pathway including resale, refurbishment, recycling, liquidation, and scrap.
Rather than relying on static depreciation assumptions or one-time valuation studies, Buckstop's residual value indexes are built from observed market data tied to actual recovery outcomes. That includes secondary market resale transactions, salvage and liquidation market activity, recycling and material recovery pricing, commodity-linked recovery economics, and asset-level characteristics including manufacturer, age, wattage, condition, and configuration. Geographic and regulatory factors that influence recovery value are also incorporated. (Buckstop platform methodology: buckstop.com/solar-residual-value-index)
The practical difference is measurable. In the case study referenced above, component-level analysis identified 389% more recoverable value than the comparable-site assumption methodology the EPC had used. That difference translated directly into bond sizing, insurance premium, and end-of-life recovery planning across four linked sites.
For lenders, the difference between a collateral valuation built on SOV assumptions and one built on transaction-backed residual value intelligence represents a real difference in collateral exposure in a distress scenario. For insurers, the difference between a 2022 replacement cost figure and a current one represents real underwriting risk. For asset owners, the difference between an accurate salvage value and an assumed one represents real capital unnecessarily locked up in decommissioning bonds for decades.
Frequently Asked Questions
What is a Statement of Values for a solar project?
A Statement of Values is a document submitted to an insurer that lists all insured assets at a solar project along with their assigned values and the valuation methodology used. It is the basis for calculating Total Insured Value, setting coverage limits, and determining insurance premiums. For utility-scale solar, the SOV typically covers modules, inverters, racking systems, transformers, BESS components, and balance of plant infrastructure.
What is solar asset replacement cost and why does it matter?
Solar asset replacement cost is the estimated cost to replace a solar asset at current market prices in its pre-loss condition, without deducting for depreciation. It matters because it is the primary basis for determining how much insurance coverage a project carries. If replacement cost is understated, the project is underinsured. If it is overstated, the project is paying excess premium. Given that US module prices rose 14% in a single year and have stabilized at a higher baseline driven by tariffs and trade policy, replacement cost figures that are not regularly updated are increasingly likely to be materially inaccurate.
How does solar salvage value affect insurance and decommissioning bonds?
Salvage value is a direct offset against both decommissioning cost and insurance valuation. State financial assurance requirements mandate that decommissioning bond amounts are calculated as estimated decommissioning cost minus salvage value. An accurate salvage value estimate reduces the required bond, freeing up capital. Buckstop's analysis of US utility-scale solar decommissioning bonds found a $195,000 per MW spread in salvage value estimates for similar assets, driven entirely by inconsistent assumptions rather than actual asset differences.
Why are solar insurance underwriting requirements tightening in 2026?
Multiple factors are converging. Severe convective storms drove $60 billion in insured losses in 2025. Hail has accounted for 42% of all US insured losses since 2020. Module prices are more volatile than at any point in the past decade. 75% of renewable energy tax insurance underwriters now refuse to cover valuation step-ups above 25%, meaning data quality has become a condition of market access rather than a differentiator. Structured, defensible valuation data is now a requirement for competitive underwriting.
What is utility-scale solar asset valuation and how is it different from residential solar valuation?
Utility-scale solar asset valuation applies to solar projects typically above 1 MW and involves component-level assessment of modules, inverters, racking, transformers, BESS, and balance of plant. It is more complex than residential valuation because assets are more diverse, replacement cost is more sensitive to bulk procurement pricing and tariff policy, and the financial instruments dependent on accurate valuation, including decommissioning bonds, project finance collateral, and insurance policies, carry significantly higher financial stakes. Renewable energy insurance underwriting data requirements for utility-scale projects are materially more rigorous than for residential or small commercial assets.
How often should a solar Statement of Values be updated?
Given current market conditions, annual updates are the appropriate standard. US module prices moved 14% in a single year. Copper rose 16% in a single month in early 2026. Silver gained over 130% during 2025. Many states require decommissioning cost estimates to be reviewed only every five years, but for replacement cost and salvage value purposes, a five-year-old figure in the current market environment is not a defensible baseline.
The Bottom Line
The solar industry is operating with an insurance and financial assurance infrastructure that was built for a slower, more predictable market. Module prices are volatile. Commodity markets are repricing sharply. Tariff policy is reshaping the economics of new supply. Antidumping duties of up to 3,521% on imports from countries that represented 77% of US module supply have fundamentally changed what it costs to replace a solar asset in the field.
A Statement of Values is only as accurate as the replacement cost and salvage value assumptions inside it. When those assumptions are built on historical data that does not reflect current market conditions, every financial instrument downstream carries the error forward into bond sizing, insurance premiums, coverage limits, and collateral assessments.
The number missing from most solar Statements of Values is not a calculation. It is a methodology. Transaction-backed, component-level, regularly updated residual value intelligence that reflects what solar assets are actually worth in the market today, not what they were assumed to be worth when the project was financed.
That is the standard the market is moving toward. And for the projects being built and financed in 2026, the gap between that standard and what most SOVs currently reflect is the risk nobody is talking about.
Buckstop builds transaction-backed residual value intelligence for solar and BESS assets across resale, refurbishment, recycling, liquidation, and scrap pathways. Explore Buckstop Residual Value Intelligence.