.png)
What Is Total Insured Value for a Solar Portfolio And Why Most Teams Get It Wrong
Managing a solar portfolio without an accurate total insured value is like navigating without a map. You are moving, but you do not actually know where you stand. Total insured value for a solar portfolio is the foundational number that determines your coverage limits, drives your premium, anchors your lender's collateral assessment, and sets the ceiling on what you can recover when something goes wrong. Get it right and every financial instrument downstream works as intended. Get it wrong and the error compounds silently across your bonds, your premiums, and your claims until a loss event makes it visible.
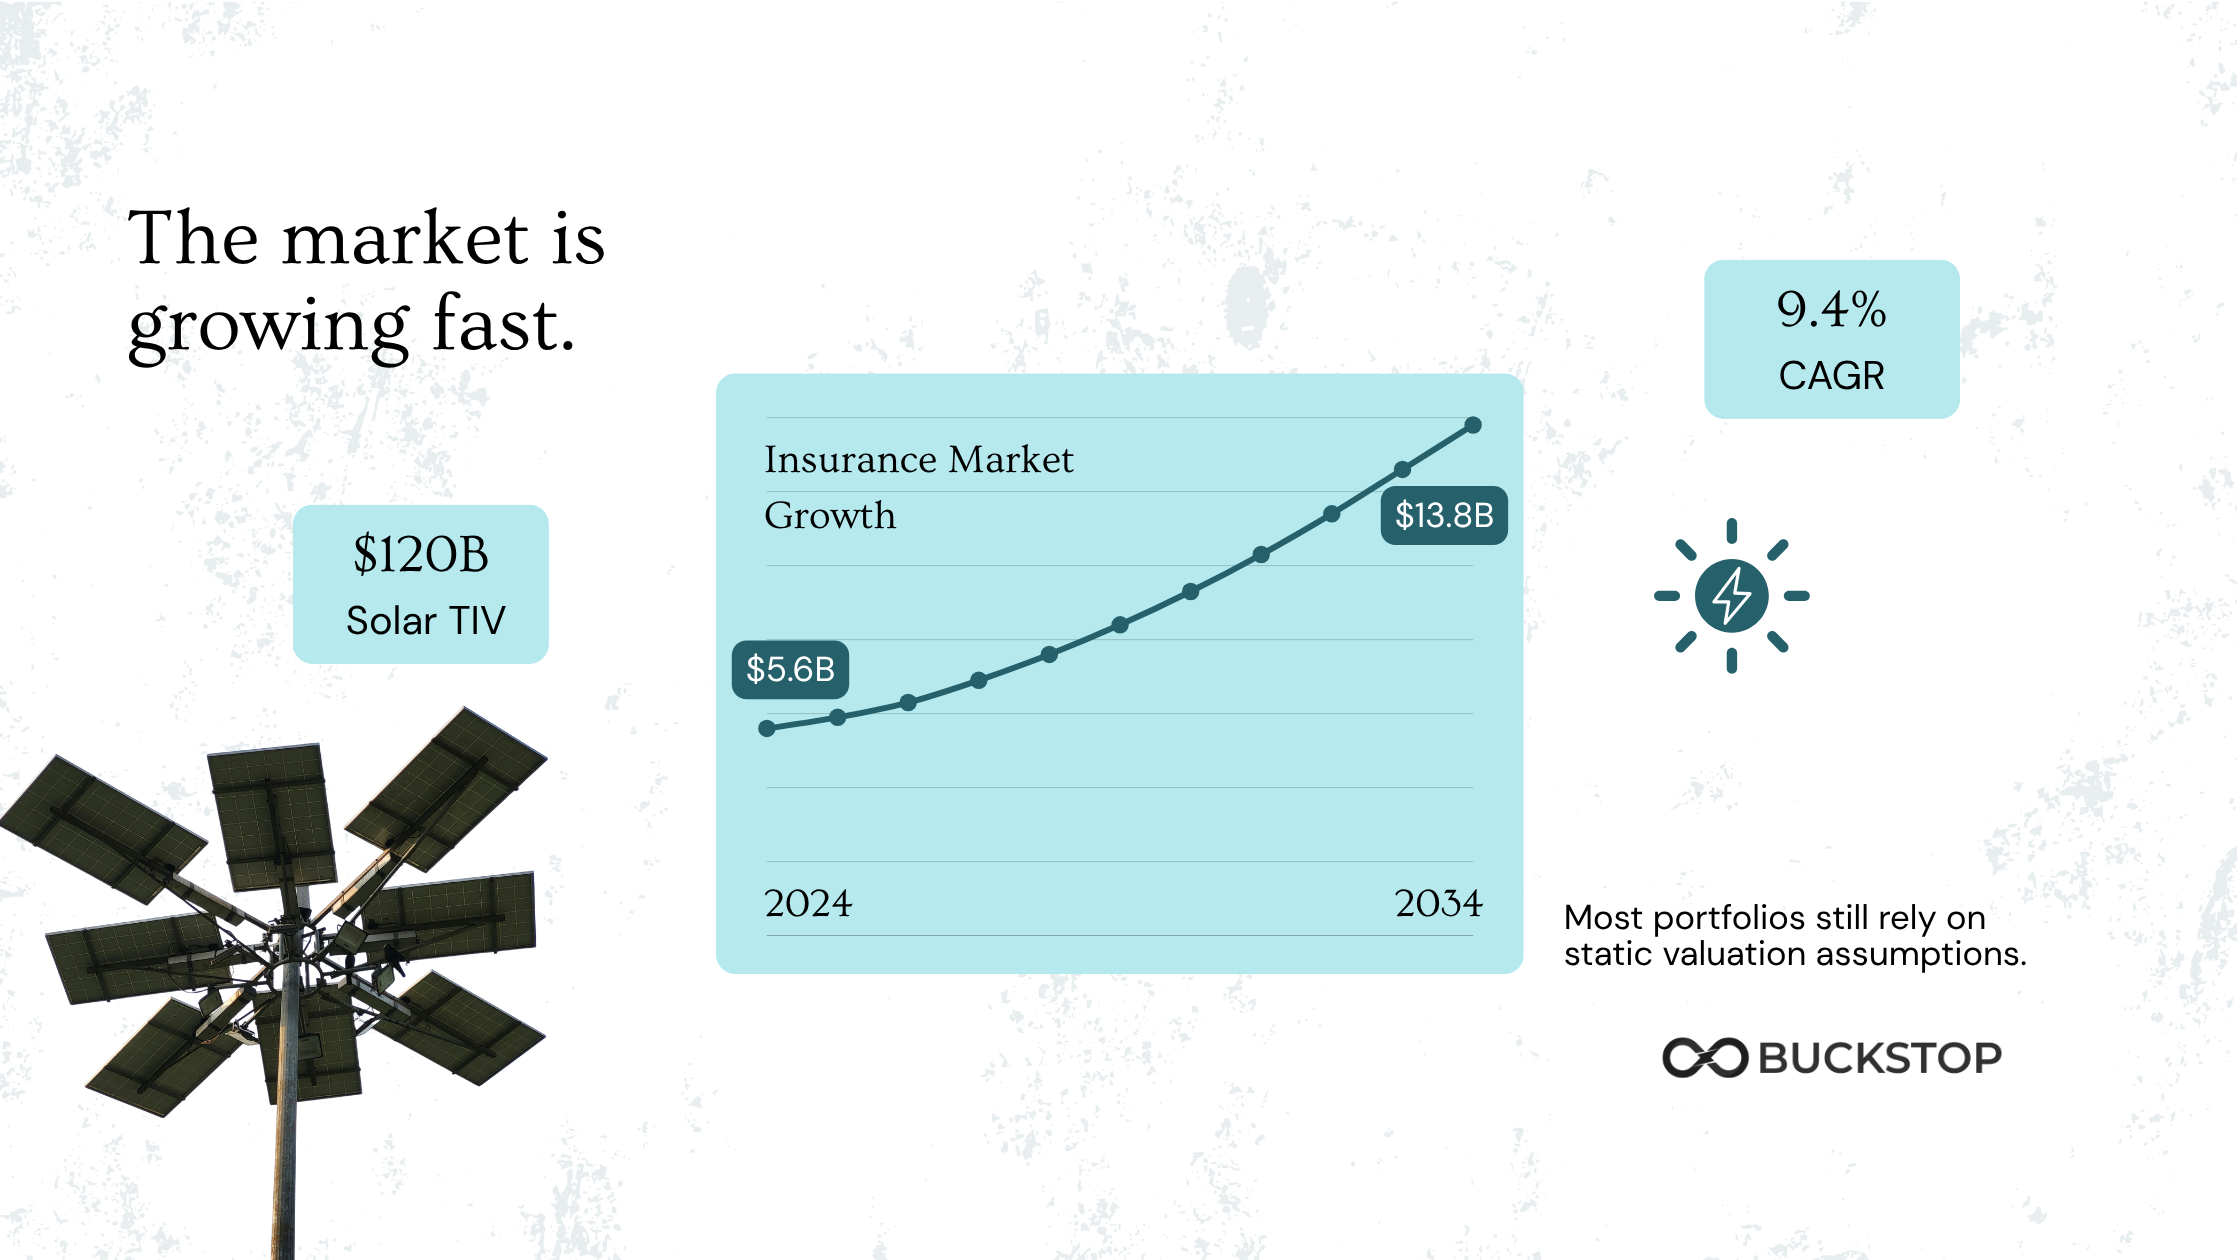
The US solar market represents approximately $120 billion in total insured values across solar assets. That number is growing fast. The global solar plant insurance market generated $5.6 billion in premiums in 2024 and is projected to reach $13.8 billion by 2034, a 9.4% CAGR. Behind that growth sits an industry-wide valuation problem that most teams are not actively managing, and that the current market environment is making significantly more expensive to ignore. Amwins: $120 billion US solar total insured values
What Total Insured Value Actually Means for a Solar Portfolio
Total insured value is the aggregate value of all insured assets in a solar portfolio as declared to the insurer. It is the sum of the replacement cost values, or in some cases actual cash values, of every insured component including modules, inverters, racking and mounting systems, transformers, BESS components, balance of plant, and civil infrastructure across every project in the portfolio.
TIV determines three things simultaneously.
- First, it sets the maximum amount the insurer will pay in the event of a total loss. If your TIV understates the actual replacement cost of your assets, you are underinsured. A loss event triggers a payout capped at the declared value, not the actual cost to replace what was lost.
- Second, it drives the premium calculation. Solar property insurance valuation is based on TIV. If your TIV overstates the actual replacement cost, you are paying premium on value that does not exist. If it understates, you are carrying risk the premium does not reflect.
- Third, for portfolios with project finance debt, TIV informs the lender's collateral assessment. A lender evaluating collateral exposure in a distress scenario needs to understand what the assets would actually recover in the market, not what they were assumed to be worth when the loan was originated.
All three of these outputs are only as accurate as the inputs. And the inputs, in most solar portfolios, are not being updated frequently enough to reflect a market that is moving faster than at any previous point in the asset class's history.
Why Solar Portfolio TIV Is Harder to Get Right Than Most Teams Assume
Accurate solar asset valuation methods for TIV purposes require tracking variables that move independently, frequently, and in ways that legacy SOV processes are not designed to capture.
Module pricing is no longer predictable
US solar module prices rose by as much as 14% between January and November 2025. By Q1 2026, median module pricing stabilized at $0.28 per watt, up from $0.25 per watt in early 2025, driven by the convergence of antidumping and countervailing duty determinations and the tightening of domestic content eligibility.
The premium for domestically produced cells versus imported modules widened to approximately $0.23 per watt, reflecting the market's willingness to pay for tax credit, tariff, and duties certainty.
A TIV built on 2022 or 2023 module pricing is not a baseline. It is understated. How much depends on the specific technology generation, the procurement profile of the original project, and the current availability of comparable replacement modules under current tariff conditions.
Component-level variation is material
Two projects with identical nameplate capacity can have meaningfully different TIV profiles depending on module technology, inverter manufacturer, racking type, battery chemistry, vintage, and condition. Mono PERC modules hit $0.33 per watt in February 2026, significantly above TOPCon at $0.285 per watt, a pricing inversion driven by FEOC compliance demand for domestically produced cells. An NMC BESS system carries different replacement economics than an LFP system. (PV Tech, April 2026)
System-level per-watt replacement cost assumptions smooth over component-level variation that materially affects what it would actually cost to replace specific assets in specific configurations at current market prices. That smoothing is where underinsurance begins.
Hail and storm risk is repricing the cost of getting TIV wrong
Severe convective storms drove $60 billion in insured losses in 2025, the third-costliest SCS year on record for insurers. Hail has accounted for more than $200 billion, or 42%, of all insured losses in the United States since 2020, compared with 34% from hurricanes.
Hail accounts for just 6% of loss incidents but 73% of financial losses at solar farms. When a hail event hits a project whose TIV was last updated in 2021, the claim is capped at a number that does not reflect what replacement actually costs in 2026. The gap between the insured value and the actual replacement cost does not stay theoretical when a loss event occurs. It becomes a real shortfall the asset owner has to fund.
The underwriting market is tightening specifically around valuation accuracy
Structured data is no longer a differentiator for insurers. It is a requirement. The kWh Analytics 2026 Solar Risk Assessment confirmed that 75% of renewable energy tax insurance underwriters will not cover valuation step-ups above 25%. That means if your portfolio TIV needs to be corrected upward by more than 25%, you are not just facing a higher premium. You are facing restricted access to the majority of the underwriting market until the valuation is brought current. University of Michigan
For utility scale solar insurance underwriting purposes, this is no longer a compliance concern. It is a market access concern.
The Four Most Common TIV Errors in Solar Portfolios
Understanding where solar portfolio TIV goes wrong is the first step to correcting it. Across the portfolios and decommissioning studies Buckstop has analyzed, the same four errors appear consistently.
Error 1: TIV calculated at financial close and never updated
Project finance timelines compress everything. TIV is calculated, the policy is placed, and the number sits on file until renewal. In many cases it is index-linked at a general inflation rate that bears no relationship to the actual movement of solar module prices, inverter costs, or labor rates in the specific geographies where the projects are located. US module prices moved 14% in a single year. General inflation indices do not capture that.
Error 2: Salvage value excluded from the net cost calculation
Solar insurance replacement cost value calculations and decommissioning bond calculations both involve the same underlying question: what is the net cost of replacing or retiring this asset after accounting for what it can recover. Salvage value is a direct offset. The copper, silver, and aluminum inside a utility-scale solar asset are not worthless at end of life. Copper hit a record $14,527 per metric ton in January 2026. Silver gained more than 130% during 2025 and reached an all-time high above $121 per ounce. (Crux Investor, March 2026 / Investing News Network, April 2026)
A TIV calculation that ignores the recoverable material value inside the assets systematically overstates net replacement cost on one end and understates salvage offset on the other. Both create financial exposure.
Error 3: Portfolio-level averaging that masks site-level variation
Large solar portfolios span multiple geographies, technology generations, manufacturers, and vintage years. Applying a single per-watt replacement cost assumption across a diverse portfolio assumes away variation that is financially material. A 2018-vintage project with first-generation PERC modules in Texas carries different replacement economics than a 2024-vintage project with TOPCon modules in California. Treating them identically for TIV purposes creates systematic error across the portfolio.
Error 4: Business interruption values not updated alongside property values
Business interruption and delay in start-up exposures are expected to increase in 2026 as aging transmission equipment and increased congestion create longer and more frequent outages, and data centers amplify local grid stress. BI values in most solar portfolios are set at financial close based on projected revenue and rarely revisited. When replacement timelines extend due to supply chain disruptions, tariff-related parts availability issues, or contractor constraints, the BI exposure embedded in the TIV grows but the declared value does not. BCC Research
The Decommissioning Bond Connection to TIV
Solar portfolio risk management professionals often treat TIV and decommissioning bond valuation as separate workstreams. They are not. They share the same underlying data requirements, and errors in one propagate directly into the other.
More than 35 states now have statewide solar decommissioning policies in place. More than half of all US states had legislative action on solar and storage decommissioning in 2025, double the number from 2024. (NC Clean Energy Technology Center, January 2026) State financial assurance requirements mandate that bond amounts cover equipment removal, recycling costs, and site restoration minus salvage value.
That legal definition, cost minus salvage value, is the same calculation that should inform the net replacement cost figure in a solar portfolio TIV. Accurate salvage value data is not just a decommissioning concern. It is a valuation concern that runs through every financial instrument tied to the asset.
Buckstop analyzed a randomized sample of US utility-scale solar decommissioning bonds from 2025 and found salvage value estimates ranging from $3,000 per MW on the low end to $198,000 per MW on the high end for similar assets. That is a $195,000 per MW gap driven almost entirely by inconsistent assumptions. (Buckstop State of Solar Decommissioning Bonds Report, 2025)
If salvage value assumptions carry a $195,000 per MW spread across the industry, and salvage value is a direct input into both decommissioning bond sizing and TIV net cost calculations, the TIV errors embedded in most solar portfolios are not marginal. They are structural.
What Accurate TIV Calculation for a Solar Portfolio Requires
Getting renewable energy total insured value right for a utility-scale or C&I solar portfolio requires four things that most existing processes are not consistently delivering.
Current component-level asset inventory
TIV accuracy starts with knowing what you actually have. Not what was specified at financial close, but what is currently in the field, by manufacturer, model, technology generation, condition, and vintage. Two projects with identical nameplate capacity can have materially different replacement cost profiles once you go component by component. System-level per-watt estimates cannot substitute for component-level inventory in a market where specific module types are pricing at 15% premiums over others due to tariff and compliance dynamics.
Current market pricing by component type
The replacement cost relevant for TIV is what it would cost to replace each specific asset type at current market prices under current tariff and supply chain conditions. That means tracking module price indices by technology type, inverter pricing by manufacturer and capacity range, racking costs by system type, and BESS pricing by chemistry and configuration. It means accounting for the $0.23 per watt premium currently attached to FEOC-compliant domestic cell supply. And it means updating those figures at least annually, or more frequently in periods of significant market movement.
Transaction-backed salvage value benchmarks
Accurate net TIV requires understanding what comparable assets are actually recovering across resale, refurbishment, recycling, and scrap pathways in real markets. Static percentage assumptions cannot track salvage value movement driven by commodity price volatility, secondary market demand shifts, or technology cycle dynamics. A benchmark built from real observed transactions, updated regularly, is the only way to produce a salvage offset figure that holds up under underwriter scrutiny.
Geographic and regulatory inputs
Solar portfolio risk management across multiple states requires accounting for state-specific labor rates, permitting costs, recycling mandates, extended producer responsibility schemes, and financial assurance requirements. California, Texas, and Arizona account for approximately 74% of utility-scale BESS capacity in the US. (SEIA Energy Storage Market Outlook, Q1 2026) Each carries distinct regulatory and cost conditions that affect both replacement cost and recovery value. A TIV that treats these states as equivalent is producing an average that accurately describes none of them.
How Buckstop Approaches Solar Portfolio Valuation
Buckstop builds transaction-backed residual value intelligence for solar and BESS assets across every recovery pathway including resale, refurbishment, recycling, liquidation, and scrap.
Rather than relying on static depreciation assumptions or one-time valuation studies, Buckstop's residual value indexes are built from observed market data tied to actual recovery outcomes. That data includes secondary market resale transactions, salvage and liquidation market activity, recycling and material recovery pricing, commodity-linked recovery economics, and asset-level characteristics including manufacturer, age, wattage, condition, and configuration. Geographic and regulatory factors that influence recovery value are incorporated.
The practical difference is measurable. In one of Buckstop’s projects, component-level analysis identified 389% more recoverable value than what the original EPC study had calculated using comparable-site assumptions. That difference translated directly into a significantly overpriced bond, insurance premium calculation, and end-of-life recovery planning across four linked sites.
For lenders evaluating collateral exposure, the difference between a TIV built on comparable-site assumptions and one built on transaction-backed component-level data represents a real difference in what those assets would actually recover in a distress scenario. For insurers pricing solar portfolio risk, the difference between a 2022 replacement cost figure and a current one is the difference between pricing the risk accurately and mispricing it in ways that only become visible at claims time.
The Bottom Line
The US renewable fleet is entering a period of unprecedented demand, and the industry is hitting a critical inflection point where operational nuance is as vital as hardware procurement. Total insured value for a solar portfolio is not a set-and-forget calculation. It is a live financial variable that moves with module prices, commodity markets, tariff policy, technology transitions, and secondary market dynamics. In 2026 those variables are moving faster and in more directions simultaneously than at any previous point in the asset class's history.
Severe convective storms drove $60 billion in insured losses in 2025. Hail accounted for 73% of financial losses at solar farms while representing just 6% of loss incidents. The loss environment has never been more demanding of accurate TIV. The market environment has never made TIV harder to calculate correctly using legacy approaches.
The teams getting solar portfolio TIV right in 2026 are the ones treating it as a data problem, not an administrative one. Component-level inventory. Current market pricing. Transaction-backed salvage benchmarks. Regular updates. Those are not nice-to-haves. In a market where 75% of underwriters will not cover valuation step-ups above 25%, they are the conditions of market access. The number sitting in your current Statement of Values is only as accurate as the last time someone went back and checked it against what the market is actually doing. When was that?
Buckstop builds transaction-backed residual value intelligence for solar and BESS assets across resale, refurbishment, recycling, liquidation, and scrap pathways. Explore Buckstop Residual Value Intelligence.
Frequently Asked Questions
What is total insured value for a solar portfolio?
Total insured value for a solar portfolio is the aggregate declared value of all insured assets across every project in the portfolio, calculated as the sum of replacement cost values or actual cash values for all insured components including modules, inverters, racking, transformers, BESS, and balance of plant. TIV is the basis for determining coverage limits, calculating premiums, and establishing the maximum payout available in the event of a loss. For a utility-scale portfolio, TIV directly informs lender collateral assessments and decommissioning bond sizing as well.
How is total insured value calculated for utility-scale solar?
Utility scale solar insurance underwriting typically calculates TIV using replacement cost value methodology, which estimates what it would cost to replace each asset at current market prices in its pre-loss condition without deducting for depreciation. Accurate TIV calculation requires component-level asset inventory, current market pricing by technology type, transaction-backed salvage value benchmarks, and geographic and regulatory inputs. Most solar portfolios calculate TIV at financial close using system-level per-watt estimates and update infrequently, creating systematic underinsurance risk as module prices, commodity values, and replacement economics move.
What is the difference between replacement cost value and actual cash value for solar assets?
Solar insurance replacement cost value covers the cost to replace an asset at current market prices without deducting for depreciation. Actual cash value deducts depreciation from replacement cost. For utility-scale solar, replacement cost is the more commonly used basis because it provides full coverage for asset replacement rather than a depreciated value that may be significantly below actual replacement cost for assets that retain significant useful life. The distinction matters particularly for older projects where ACV may understate replacement cost significantly relative to current module pricing.
Why does solar portfolio TIV become inaccurate over time?
Solar portfolio TIV becomes inaccurate over time because replacement economics change faster than most SOV update cycles. US module prices moved 14% in a single year. Copper rose 16% in a single month in early 2026. Antidumping duties of up to 3,521% on solar imports from four countries representing 77% of US supply fundamentally changed what replacement costs for many common module types. Technology transitions from Mono PERC to TOPCon have inverted the pricing relationship between technology generations. Most TIV update cycles, whether annual index-linking or periodic revaluation, are not designed to capture changes of this speed and magnitude.
How does salvage value affect solar portfolio TIV and insurance?
Salvage value is a direct offset against net replacement cost in TIV calculations. The recoverable material value inside solar assets, including copper, silver, aluminum, and other critical minerals, affects the net cost of asset replacement and recovery. In 2026, copper is above $13,000 per metric ton and silver gained more than 130% during 2025. A TIV calculation that uses an outdated or understated salvage value assumption overstates net replacement cost and inflates the required premium and bond. An accurate, transaction-backed salvage value benchmark is as important to TIV accuracy as an accurate replacement cost figure.
What happens if solar portfolio TIV is wrong at the time of a claim?
If TIV understates actual replacement cost, the policy payout is capped at the declared value. The asset owner must fund the gap between the insured value and the actual replacement cost from other sources. If TIV overstates actual replacement cost, the asset owner has been paying premium on value that does not exist. In both cases the financial exposure is real. The tightening of the underwriting market, with 75% of renewable energy tax insurance underwriters refusing to cover valuation step-ups above 25%, means that correcting a materially understated TIV at renewal is no longer straightforward. It requires defensible, current, transaction-backed data to support the revised figure.
How often should solar portfolio TIV be updated?
Given current market conditions, annual updates reflecting current module pricing, current commodity values, and current secondary market transaction data are the minimum appropriate standard. In periods of significant market movement, such as the 14% module price increase seen in 2025 or the copper price spike of early 2026, more frequent updates may be warranted. Many state decommissioning regulations require cost estimates to be reviewed only every five years. That cycle is not adequate for TIV purposes in the current market environment.